Analytics
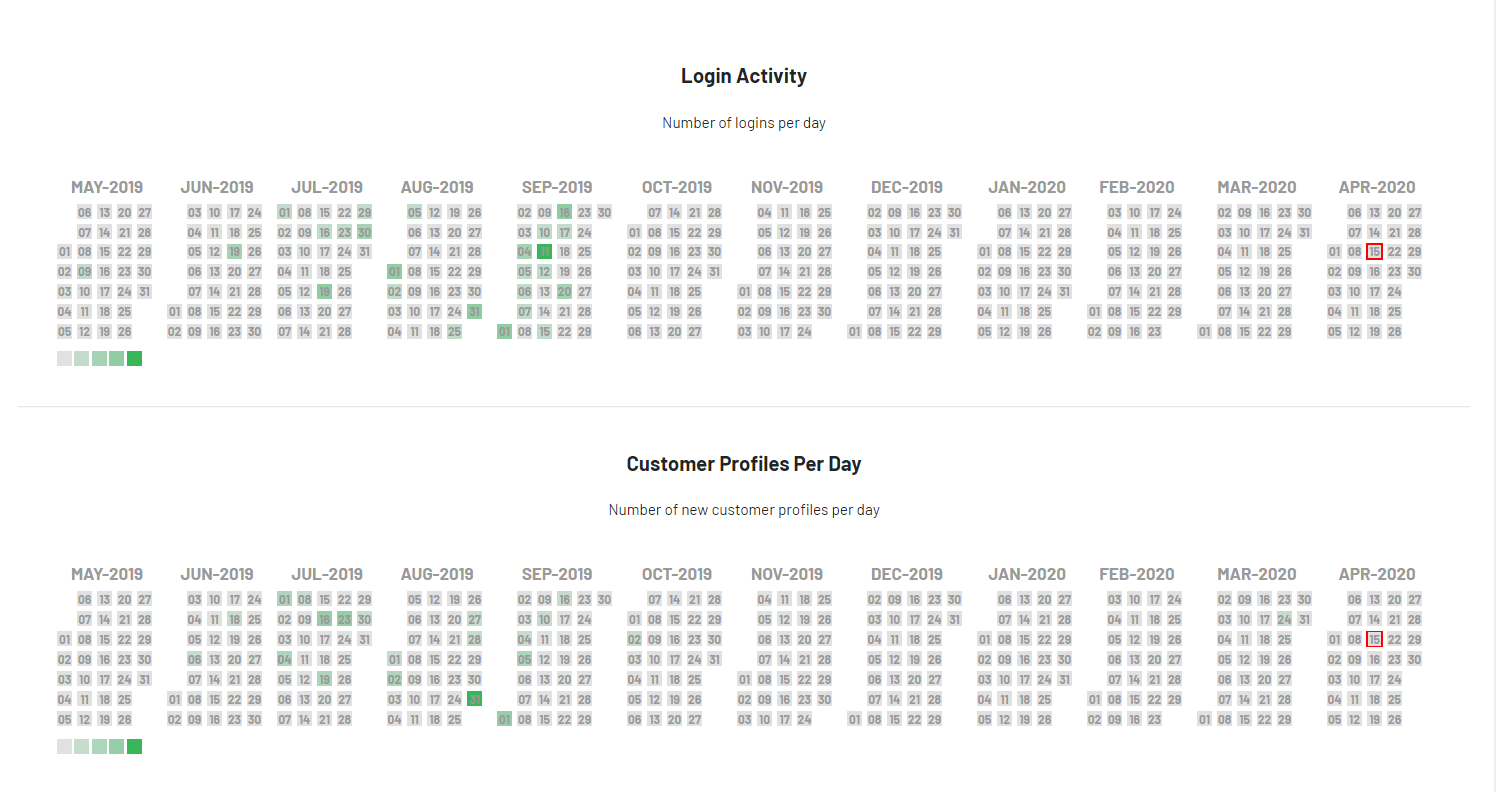
"Overview" is the first section in the Customer Insights area. The calendar layouts at the top serve as a "heat map" for site login and new user activities. This will let you see what days out of the year your site experienced the highest and lowest login and new user registration volumes. Hover over any day for a quick look at the number of logins and new users on any given day throughout the past 12 months.
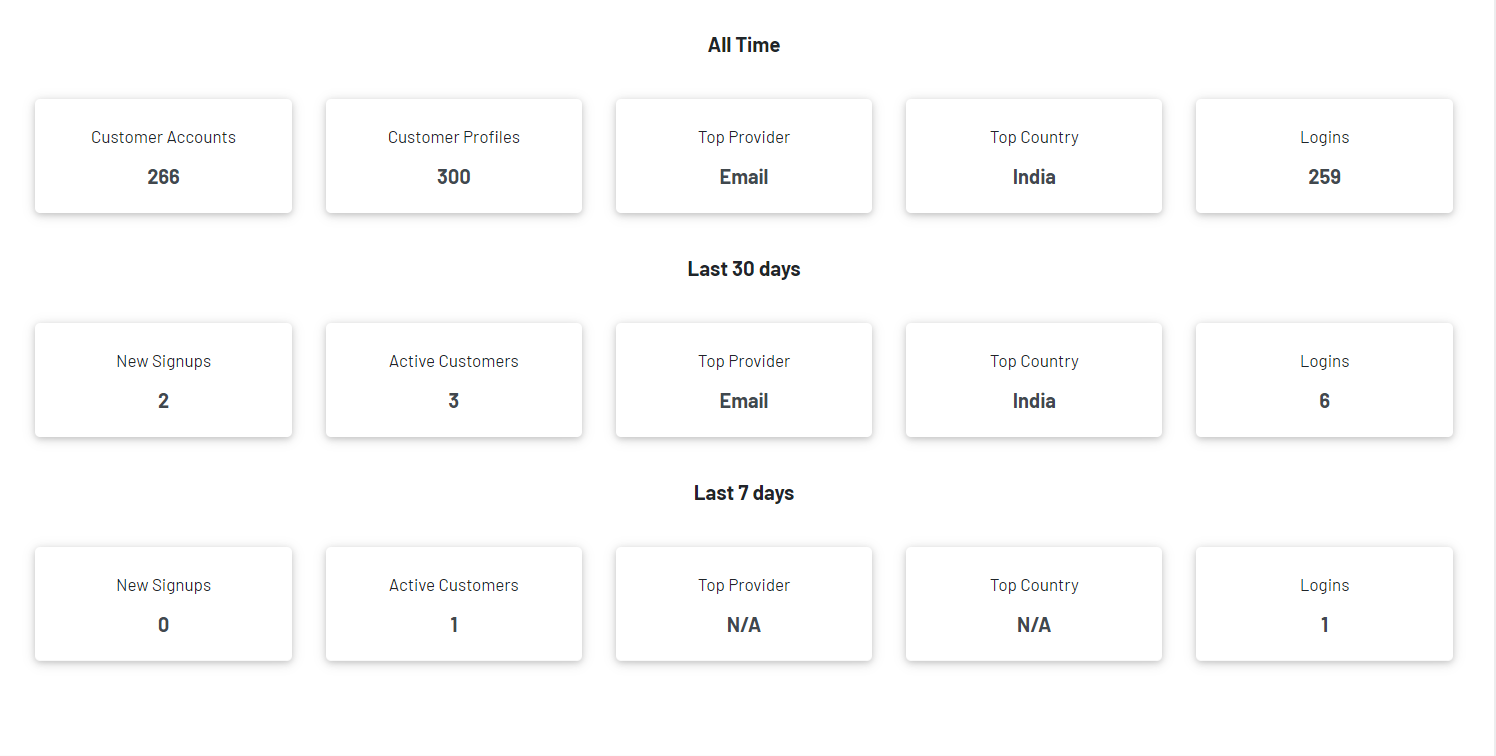
All Time
Below the heat map, you will see twelve different statistics. The first row will show you the number of User Accounts and User Profiles that are currently registered with your site, the most common ID provider users choose to login with, and the number of total logins that have occurred on your site.
Last 30 Days and Last 7 Days
The middle and last rows analyze your site activity over the past 30 and 7 days. "New Signups" refers to new User Profiles that have been created over the past 30 and 7 days, and "Active Customers" refers to the number of User Profiles that have logged in over the specific time period.